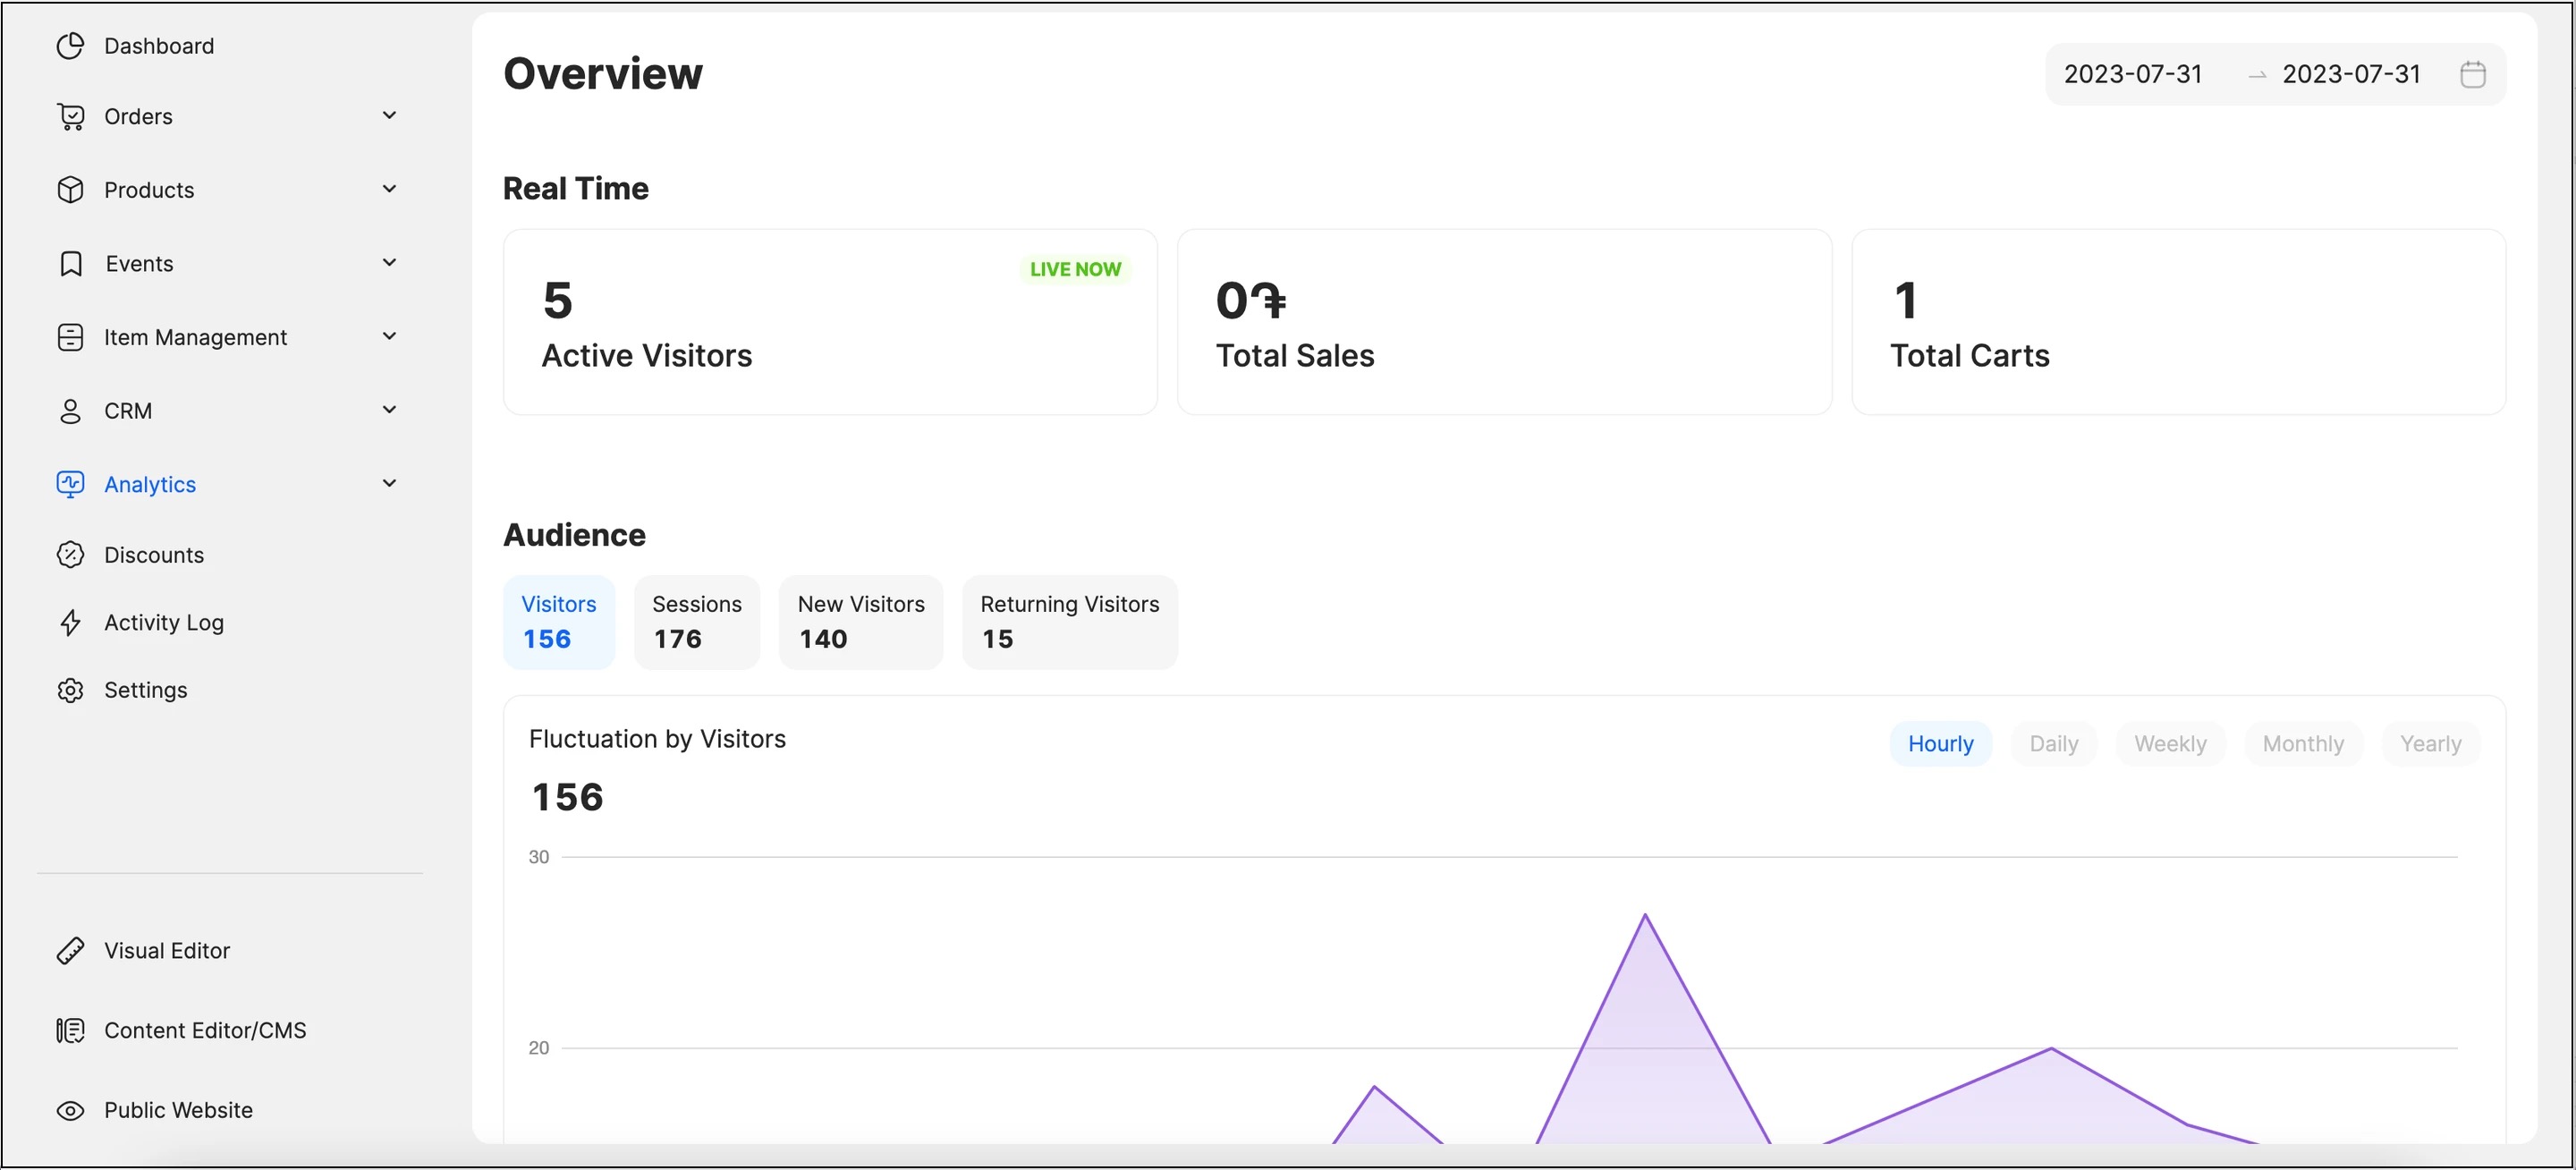
The Analytics dashboard serves as a centralized hub for monitoring and analyzing key metrics that directly impact your store performance. The data includes how the store/website is performing—across all of your sales channels, and for any date range. This comprehensive section empowers you to make data-driven decisions and optimize your online business for success.
Here you can:
- filter data based on dates;
- check real-time activities on your website;
- track your website visitors;
- understand the time and average statistics on your website;
- track your average order value;
- understand where your visitors are coming from—organically, by social media, or other sources;
- monitor the trends over time.
Accessing Real Time Data
The Real Time section allows you to view real-time visitor data, sales statistics, and cart numbers. This information offers invaluable insights into your store traffic metrics that include:
| Metric | Real-time information displayed |
| Active Visitors | Provides a live view of the visitors currently browsing your online store. |
| Total Sales | Displays the cumulative value of all sales transactions occurring in real time in the default currency of the store. |
| Total Carts | Shows the total number of active shopping carts at any given moment. |
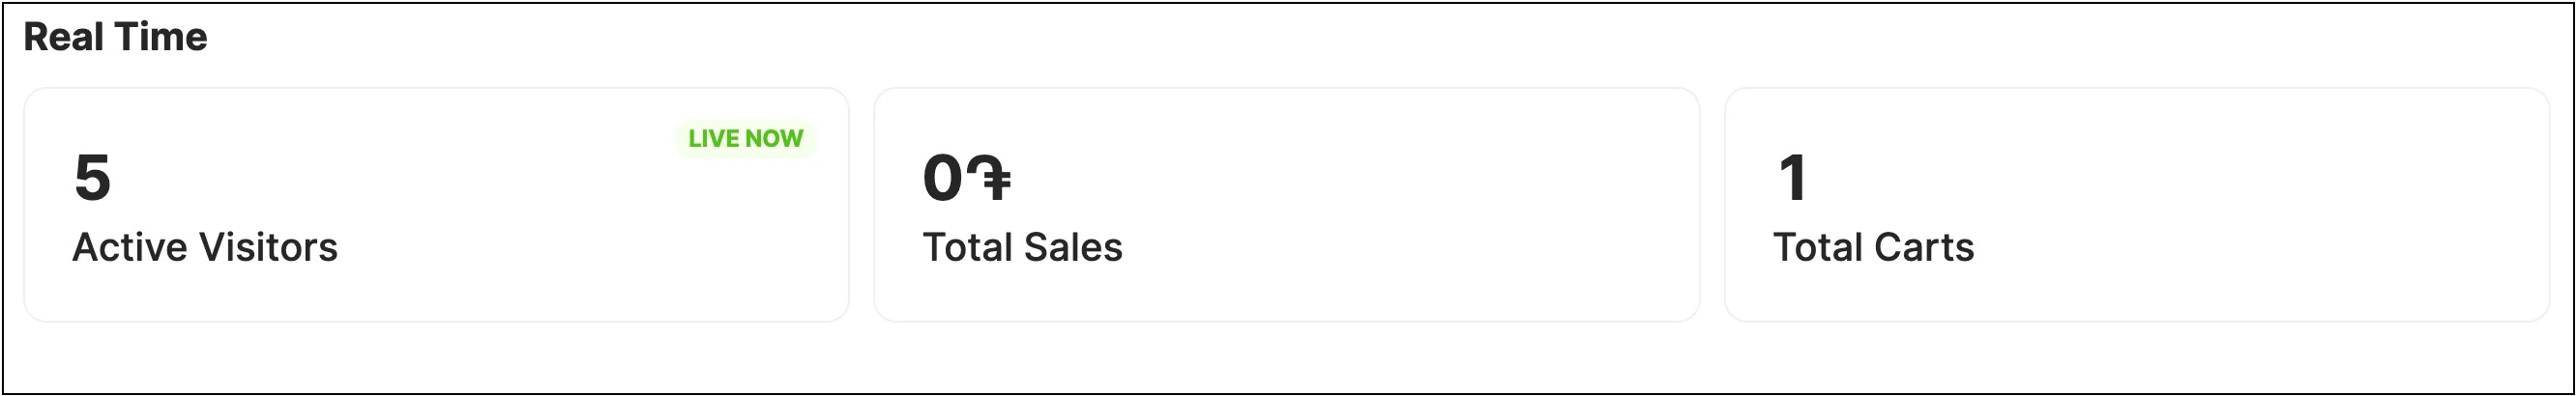
ℹ️ The real-time data is displayed based on the visitor session on the website which lasts for 15 minutes. When the session is over, the numbers will be deducted.
Filtering Data by Date
Filtering allows you to analyze and focus on specific time periods for a more detailed understanding of your store performance. Click on the date field in the upper right corner and customize the data displayed on the dashboard to match your preferred date range, empowering you to make data-driven decisions and gain valuable insights into your business trends.
Understanding the Analytics Dashboard
Presenting up-to-the-minute data allows you to stay informed about crucial aspects of your business and respond quickly to emerging trends. Dashboard consists of these sections:
- Audience
- Behavior
- Conversion
- Acquisition
Audience
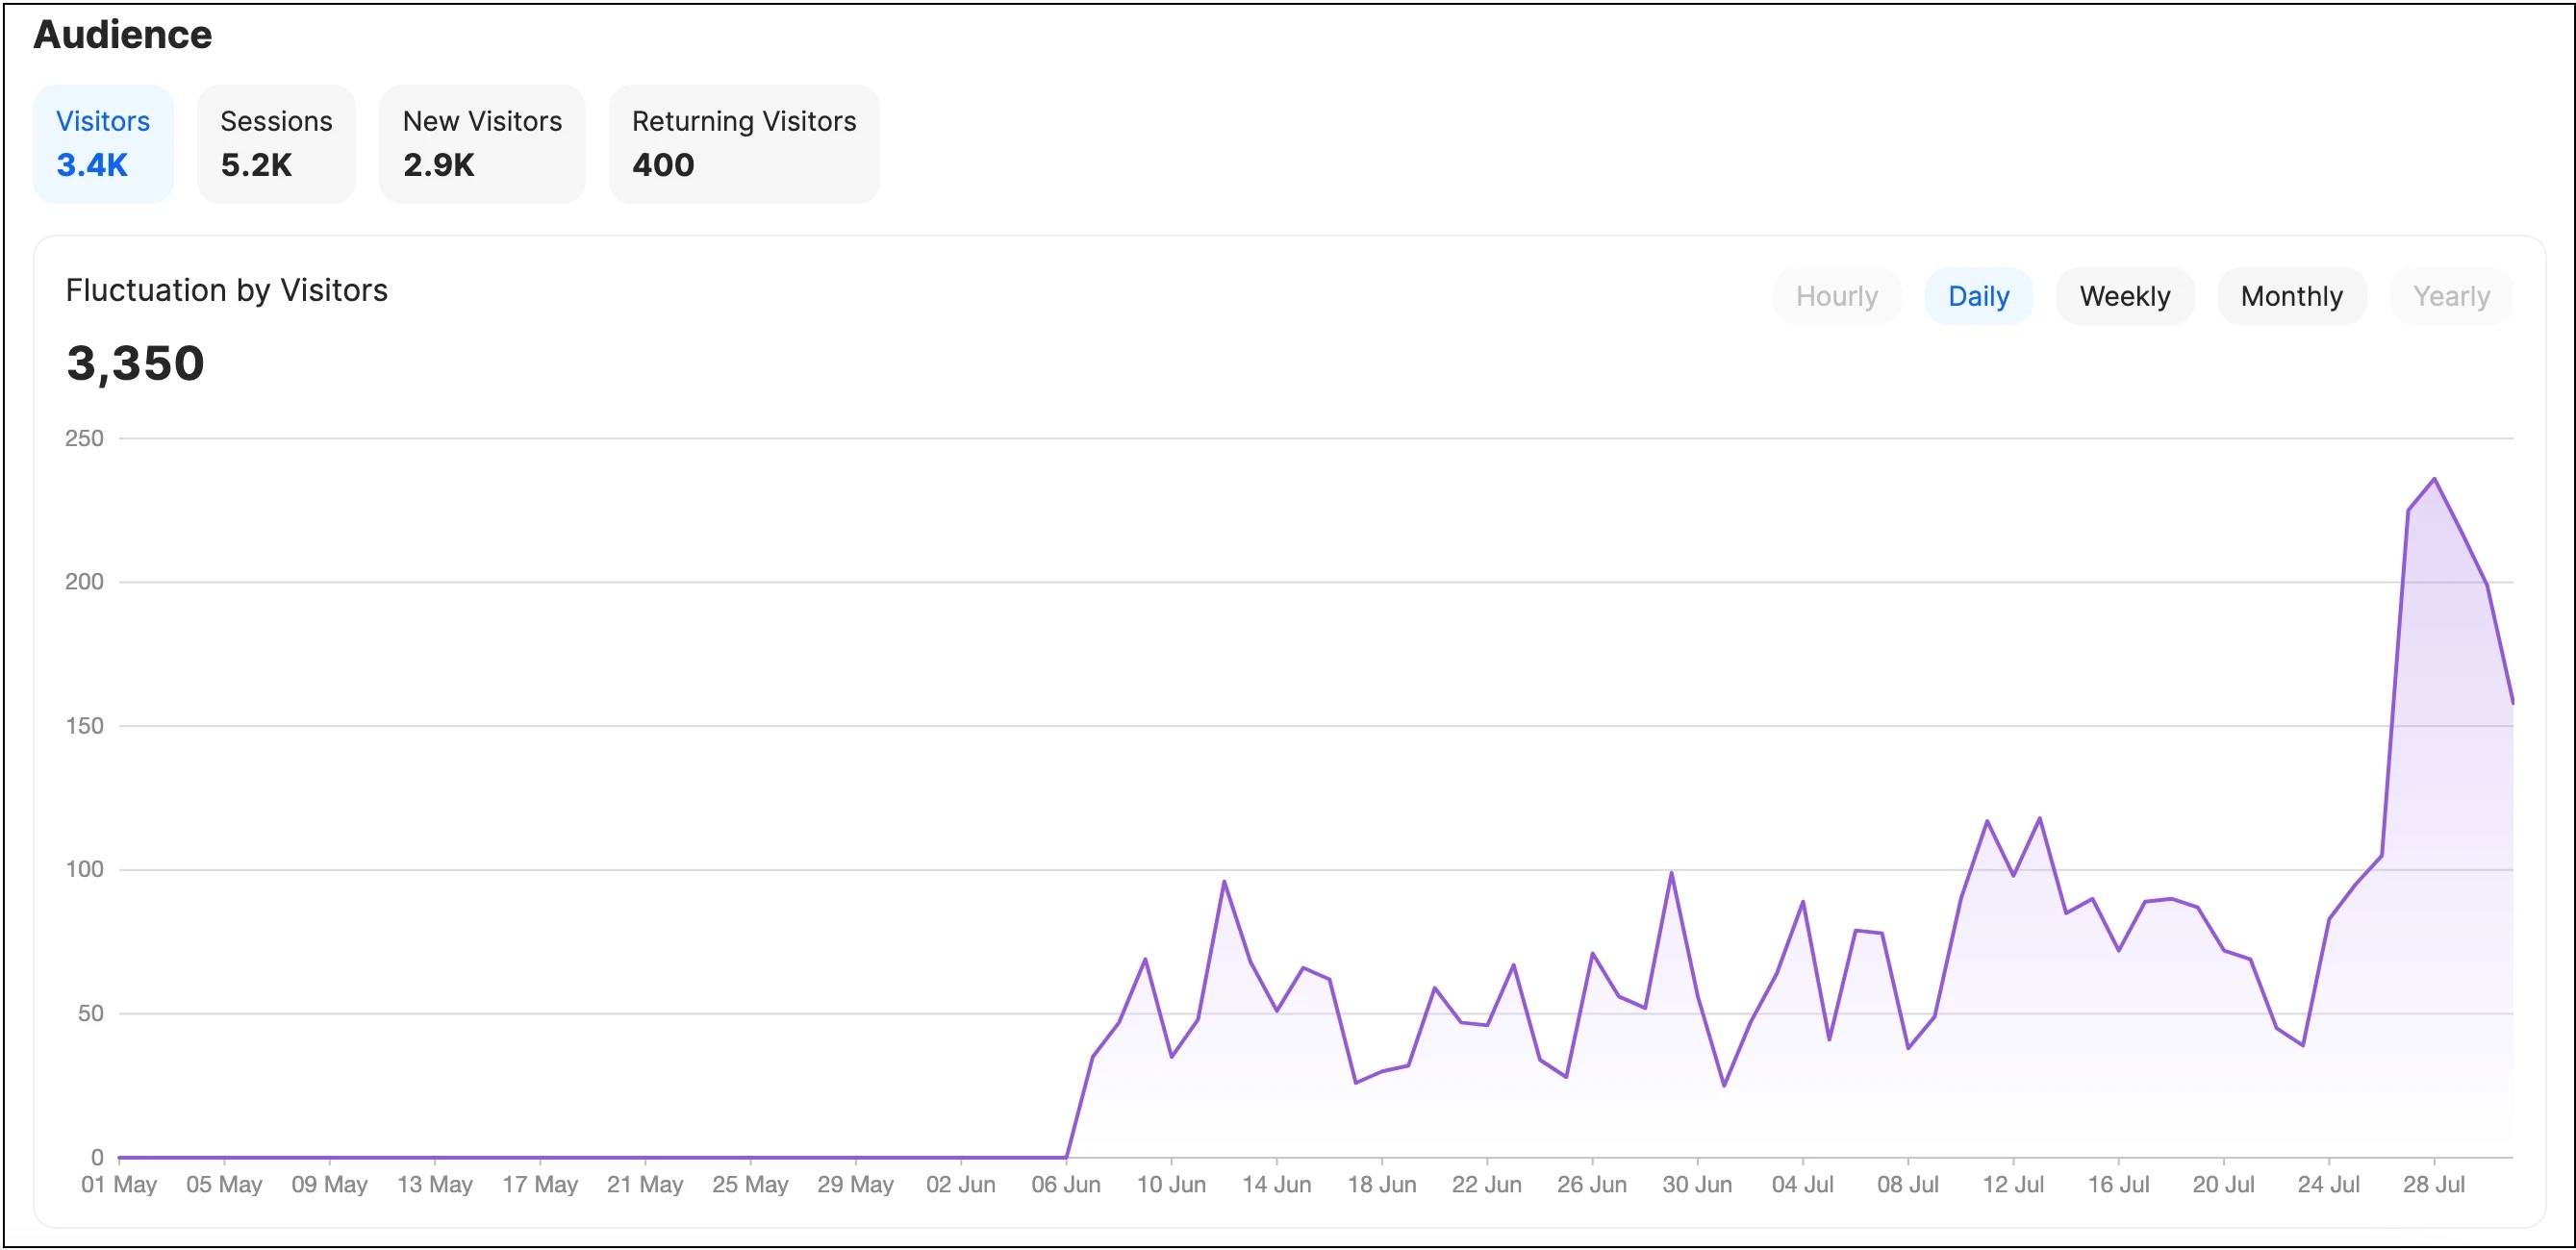

The Audience section focuses on understanding the visitors to your online store. It consists of the following key metrics:
| Metric | Information displayed for the date range |
| Visitors | Displays the total number of unique visitors to your website. |
| Sessions | Represents the total number of browsing sessions initiated by visitors. |
| New Visitors | Shows the number of first-time visitors to your website. |
| Returning Visitors | Indicates the number of visitors who have previously visited your site and returned for another session. |
)
Behavior
The Behavior section allows you to understand how visitors interact with your website. It includes the following key metrics:
| Metric | Information displayed for the date range |
| Page Views | Shows the total number of pages viewed by visitors on your website. |
| Bounce Rate | Indicates the proportion of visitors who leave your site after viewing only one page in percentage. A high bounce rate may suggest that your website needs improvements to retain visitors. |
| AVG Time on Page | Calculates the average time visitors spend on each page of your website. |
)
Conversion
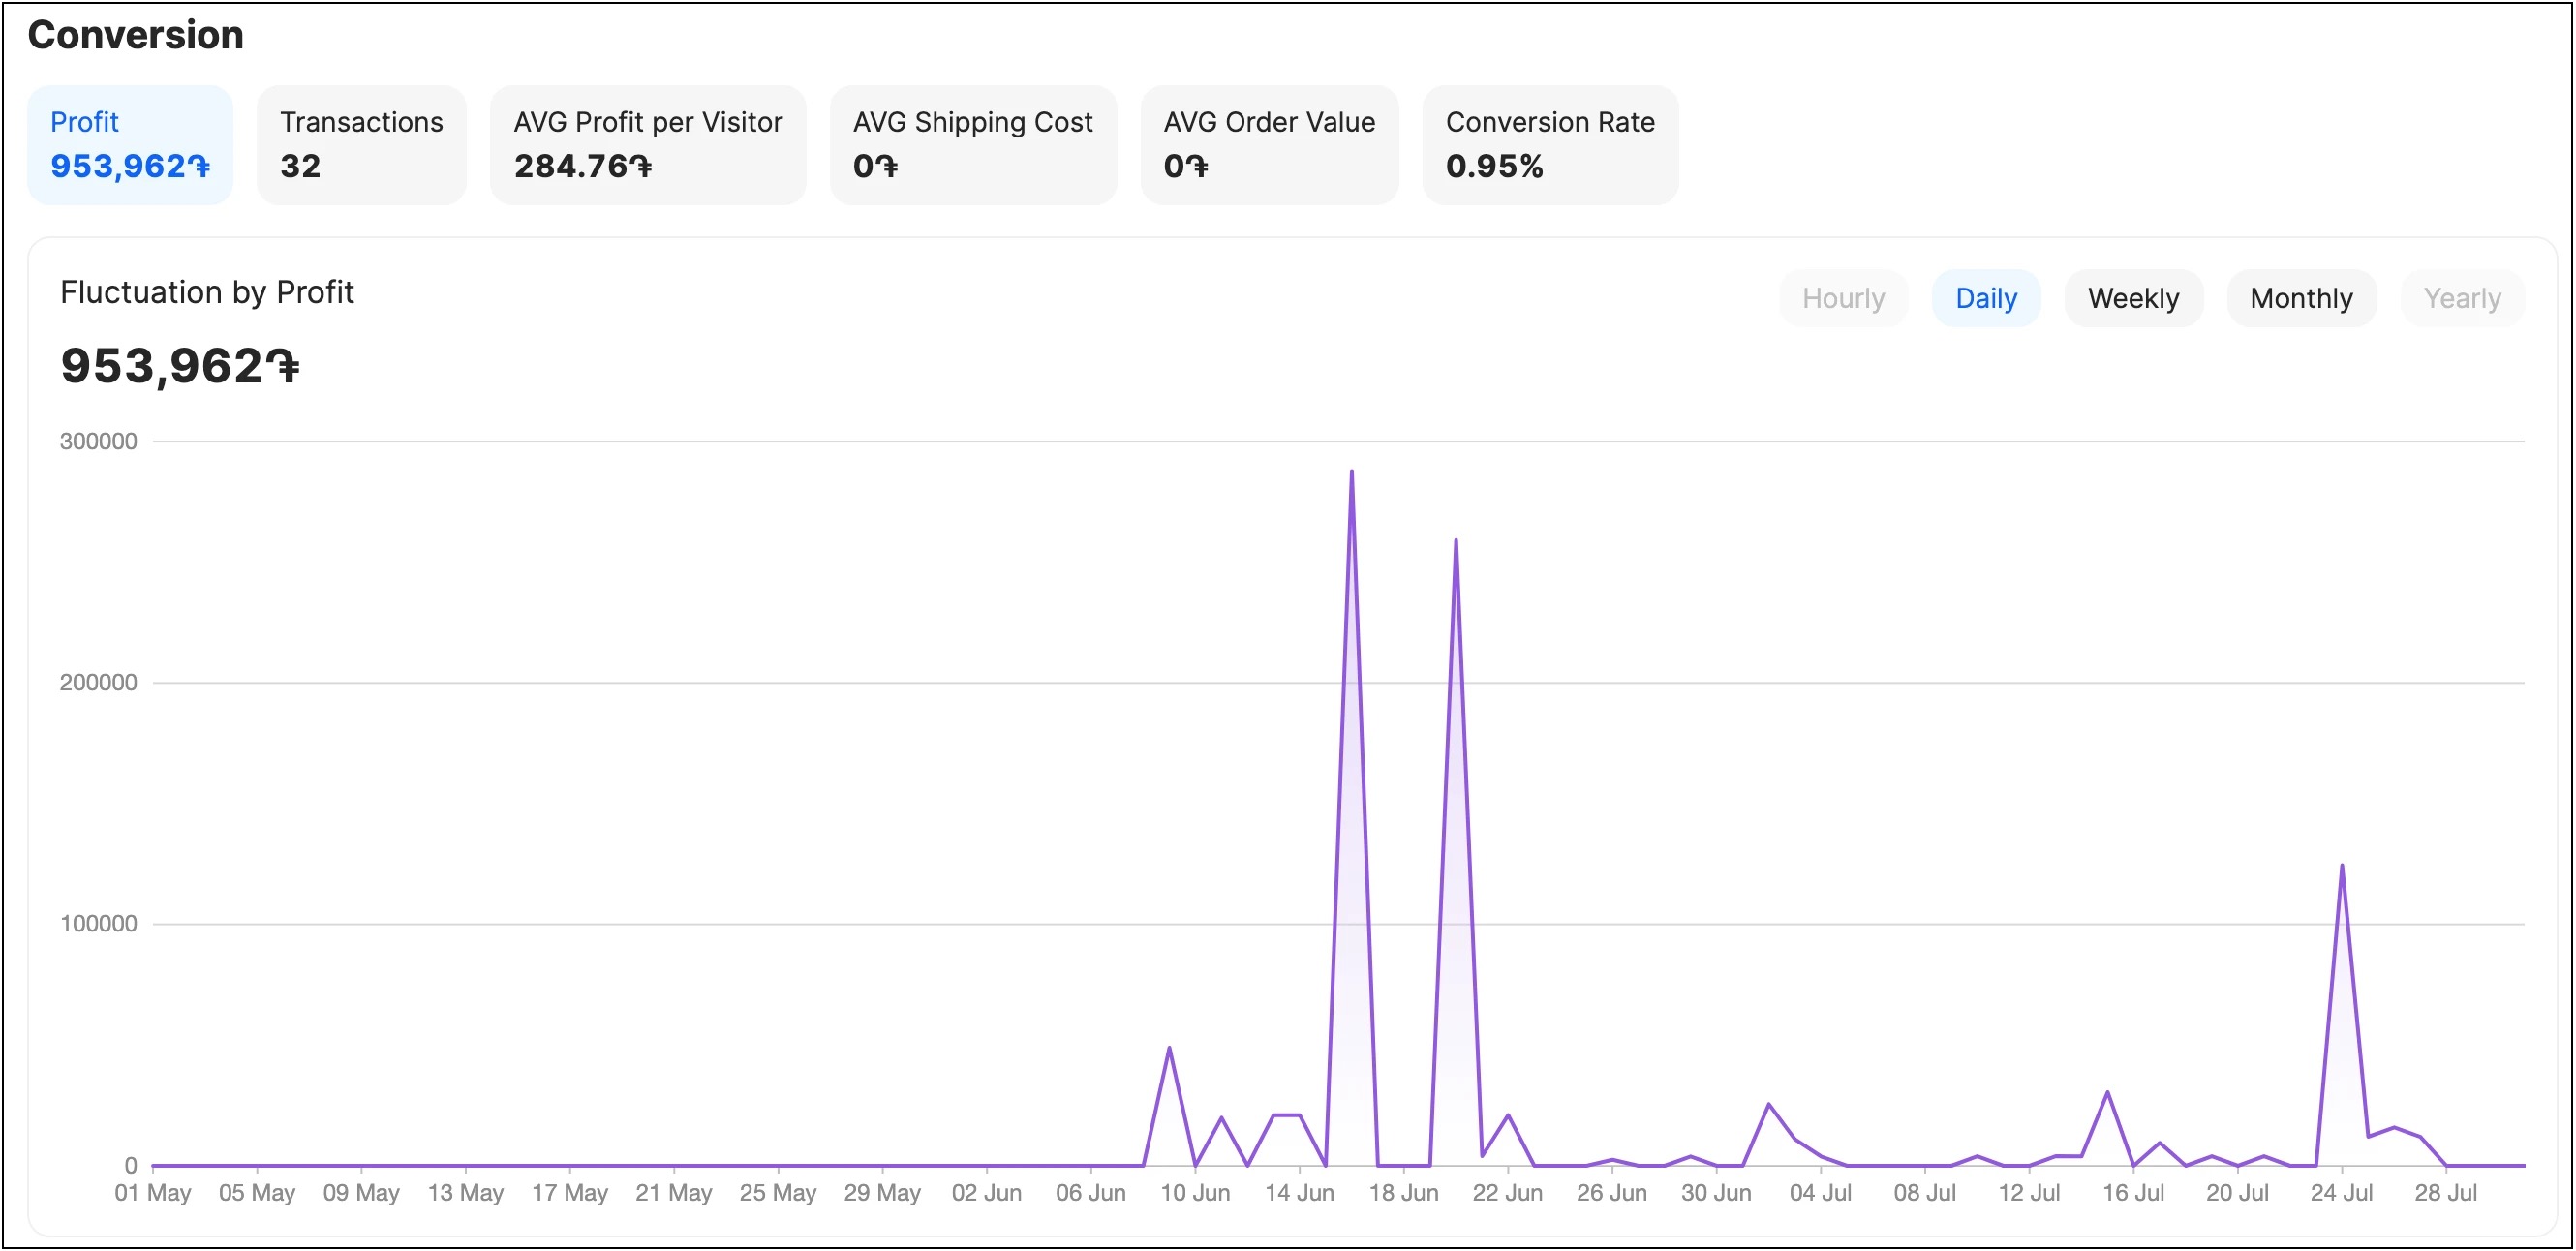
The Conversion section focuses on metrics related to the success of your online store sales and profitability. It includes the following key metrics:
| Metric | Information displayed for the date range |
| Profit | Represents the overall sum of revenue generated from orders. If the products' cost is indicated, it is reduced from the sum. |
| Transactions | Indicates the total number of placed orders. |
| AVG Profit per Visitor | Calculated by dividing the profit by the number of website visitors, provides insights into your store's revenue generation per visitor. |
| AVG Shipping Cost | Displays the average shipping cost incurred per order. |
| AVG Order Value | Calculated by dividing the total cost of all orders by the number of transactions, provides insights into the average value of each order. |
| Conversion Rate | Shows the relationship between the number of unique visitors and the number of placed orders represented as a percentage. |
)
Acquisition
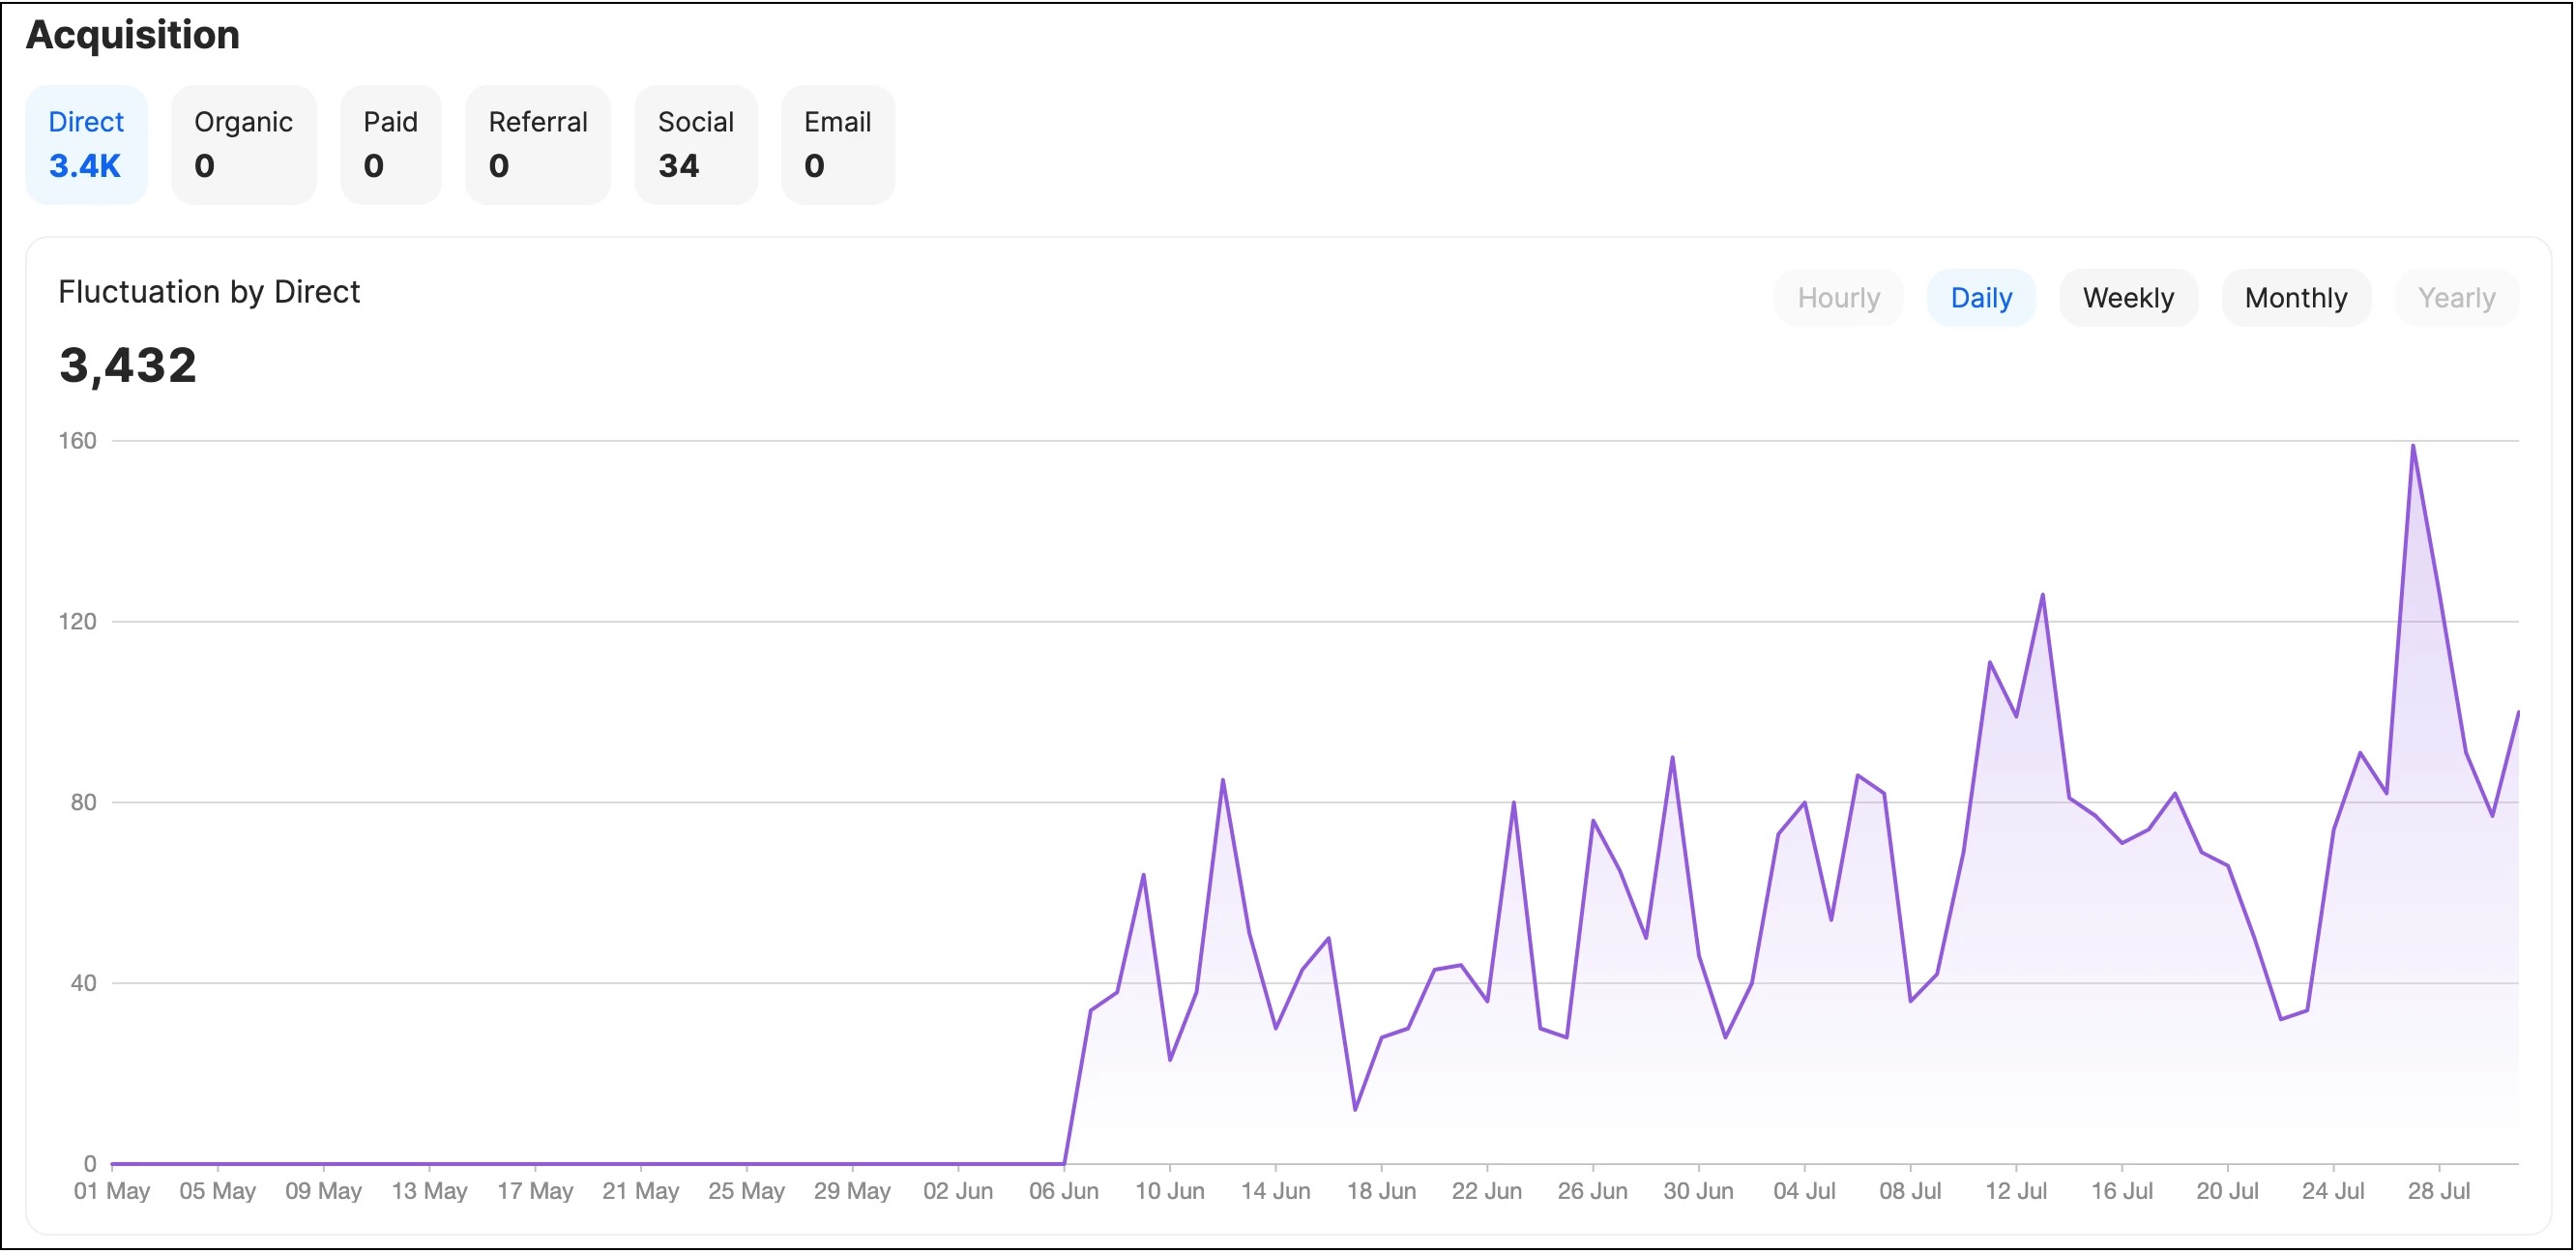
The Acquisition section provides insights into the sources from which visitors come to your website. It consists of the following metrics:
| Metric | Information displayed for the date range |
| Direct | Represents visitors who directly accessed your website by typing the URL or using bookmarks. |
| Organic | Shows visitors who found your website through search engines like Google. |
| Paid | Indicates visitors who arrived at your site via paid advertisements or campaigns. |
| Referral | Displays visitors who reached your website through external links on other websites. |
| Social | Shows visitors who came to your website through social media platforms. |
| Represents visitors who arrive at your site through email marketing campaigns. |
)
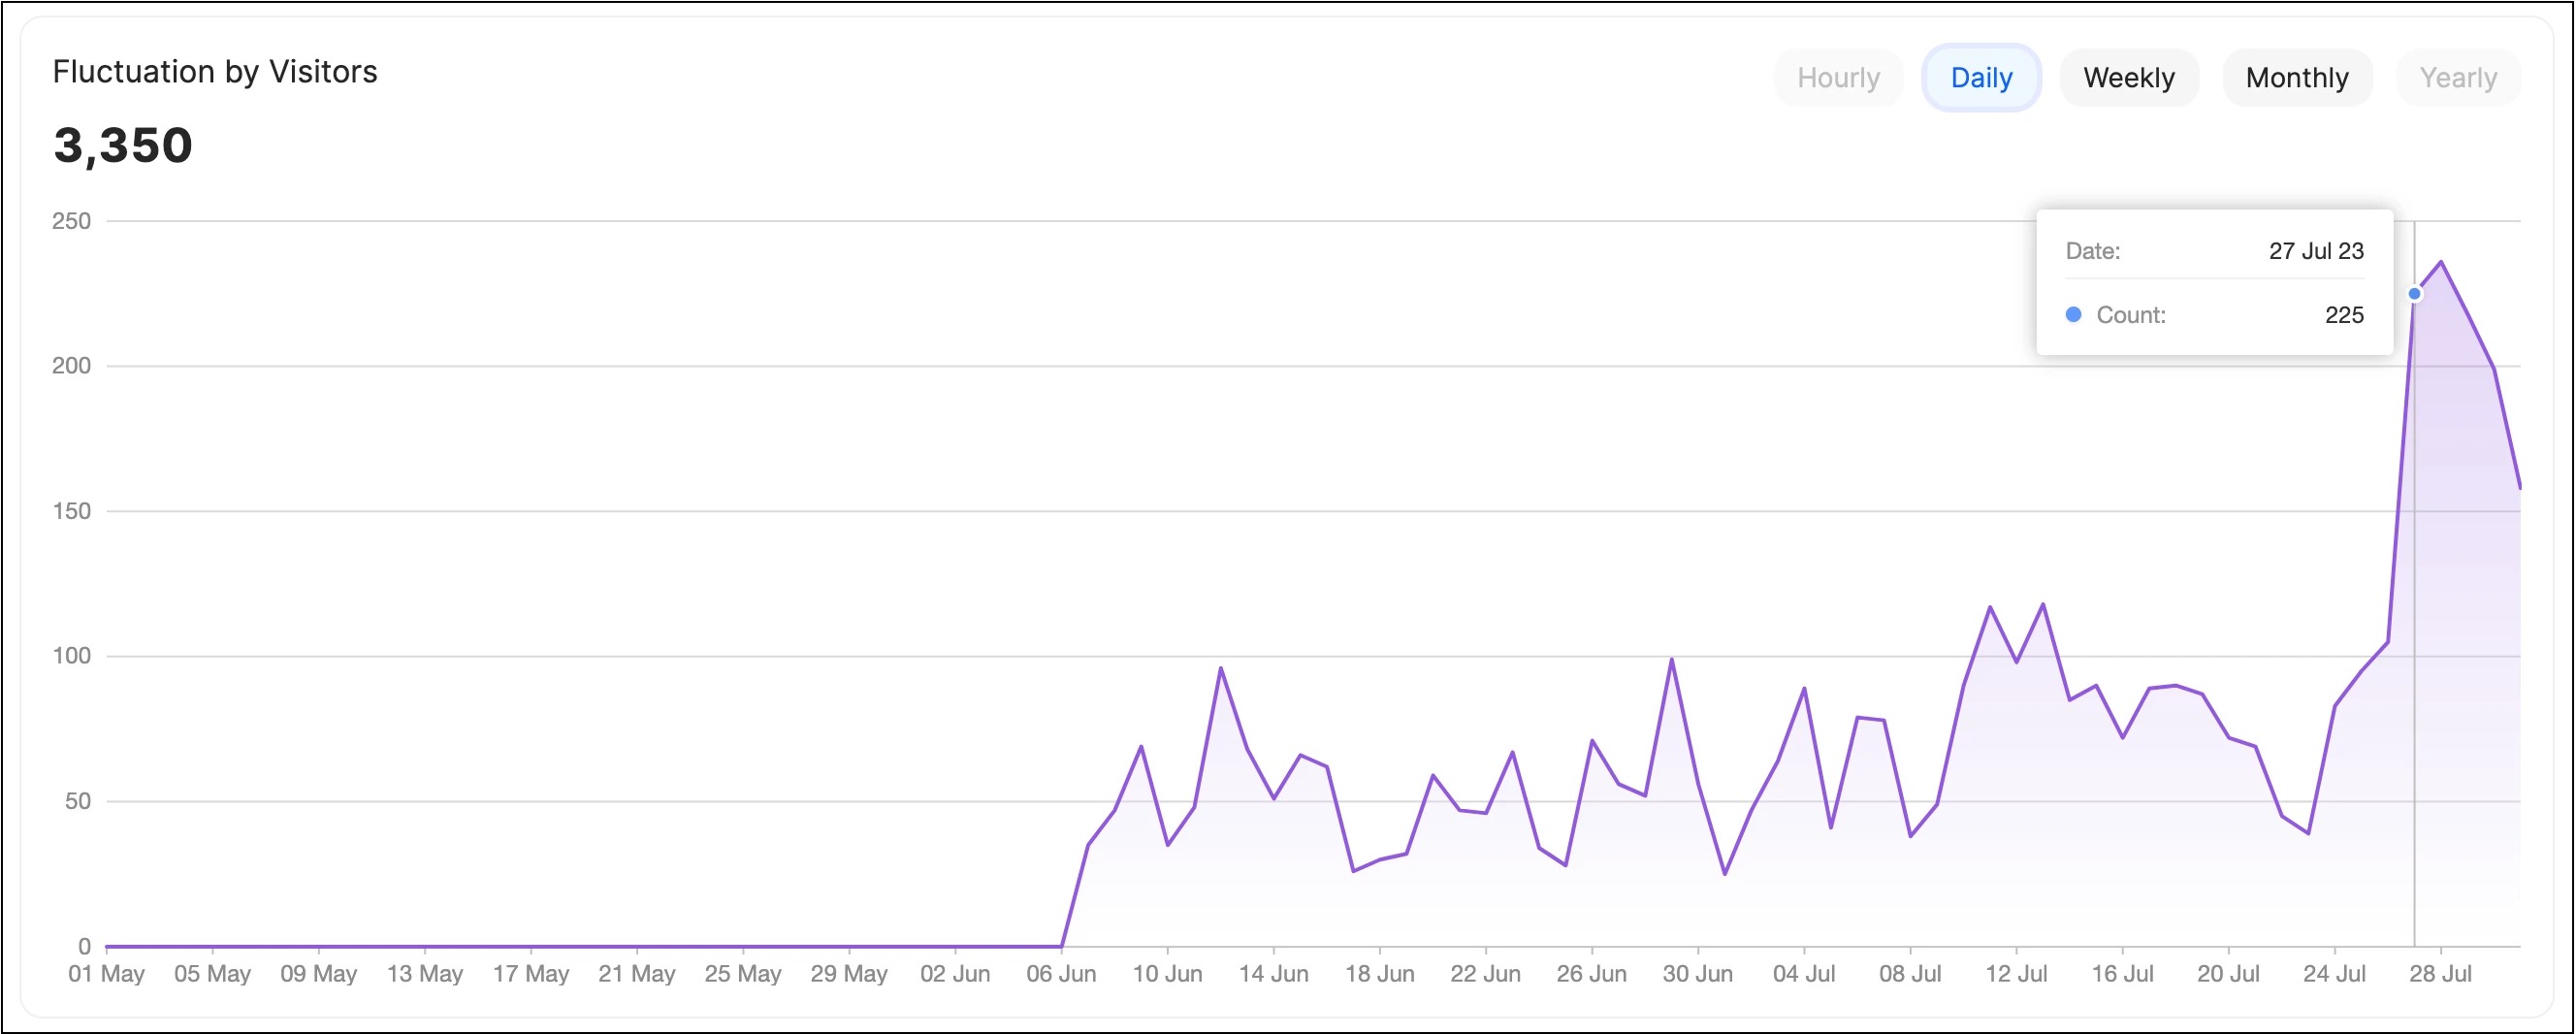
Using Fluctuation for Detailed Data
To provide deeper insights, all sections offer a visualization of these metrics' fluctuations over time. By selecting different time filters: Hourly, Daily, Weekly, Monthly, and Yearly; you can analyze how these metrics vary across different periods. Understanding the trends and patterns in visitor data helps you tailor your marketing strategies and improve customer experience.
By exploring the metrics and their fluctuations across different time periods, you can gain valuable insights into your store performance, identify trends, and make data-driven decisions to optimize your online business effectively.

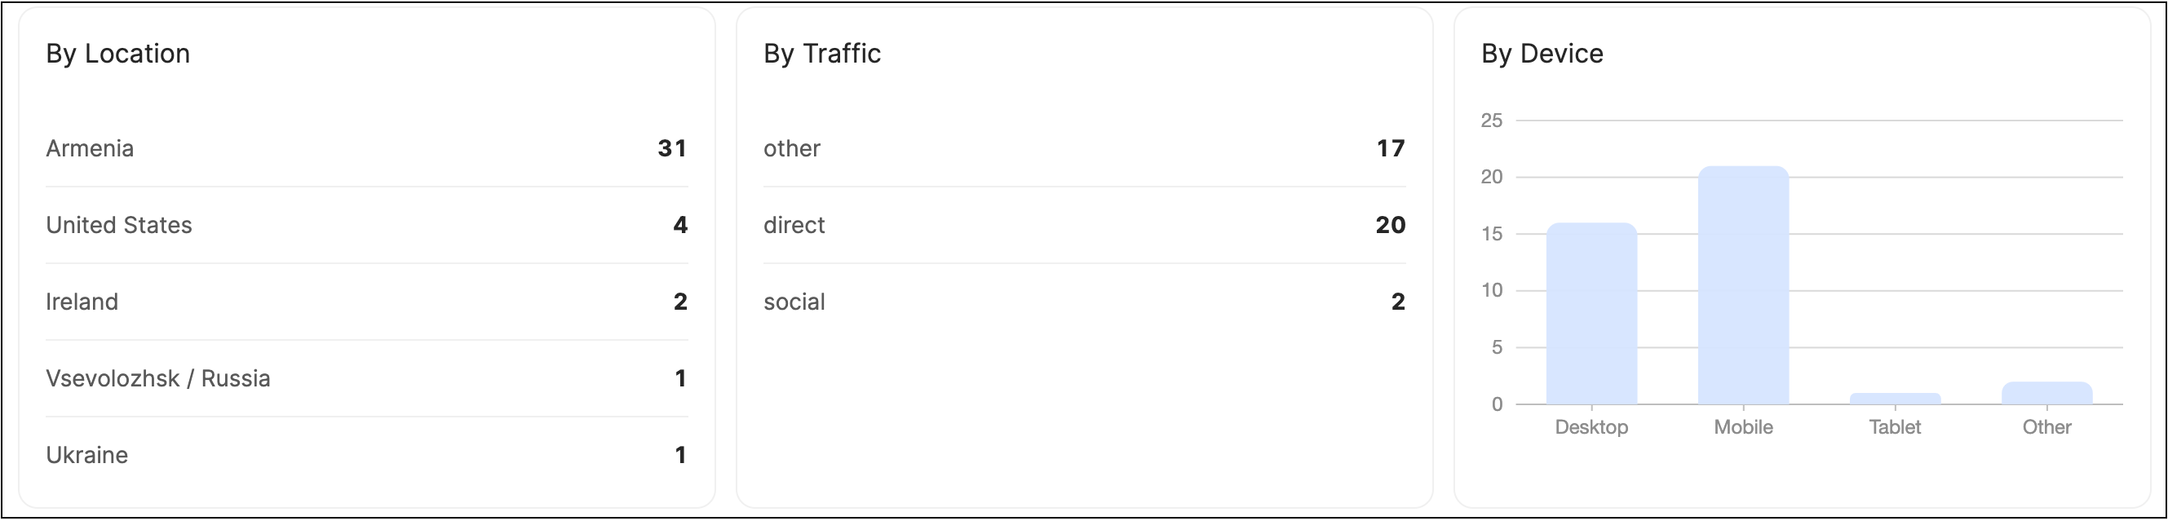
Accessing Additional Analytical Data
Analytics dashboard provides valuable insights into how visitors interact with your online store and explore three essential aspects: By Location, By Traffic, and By Device.
By Location
These data provide valuable insights into the geographical distribution of your website visitors. It showcases the countries and/or cities from which your traffic originates. Understanding the geographic location of your audience is crucial for tailoring marketing strategies, optimizing shipping and logistics, and delivering region-specific content that resonates with your visitors.
By Traffic
These data offer insights into how visitors arrive at your online store from different sources. It categorizes traffic into various channels, such as direct traffic, referral links, search engines, social media platforms, or email marketing campaigns. Analyzing these data allows you to assess the effectiveness of different marketing channels, identify high-converting sources, and optimize your marketing budget accordingly.
By Device
These data provide a breakdown of your website traffic based on the devices visitors use: Desktop, Tablet, Mobile, and Other. Given the increasing prevalence of mobile browsing, understanding your audience device preferences is essential for delivering a seamless user experience. Analyzing these data allows you to identify potential user experience issues, optimize website performance, and capitalize on opportunities to enhance customer satisfaction and increase conversions.
💡 If you have questions or concerns, contact us directly via the Live Chat box in the lower right corner. Our Support Team will provide you with top-notch quality support 24/7.